Ecological accounting is the ecological equivalent to the preparation of financial accounts.
In 1993 a paper entitled the “Optimum Population of the United Kingdom” was presented at the First World Optimum Population Conference in Cambridge UK. In this paper it was concluded that the United Kingdom was grossly overpopulated and would only be ecologically and environmentally sustainable at a population level of between 10 to 30 million. Other scientists went further and stipulated that the optimum population of this planet should be approximately 2 billion.
This information showed a considerable leap forward, because, up to that time, although most people suspected that this planet was overpopulated there had been very little science to back this up.
Since that time a multitude of research work was carried out by many scientists globally in order to compute a sustainable population of this planet, and as a result, some very clever people have come up with a ground breaking concept known as the “Ecological Footprint”. This is a way of determining the impact of human consumption on this planet.
In the early 1990’s an organisation which became known as the Global Footprint Network developed the first reliable and understandable method of ecological accounting.
This accounting system is now used today in many decision making processes by organisations such as the WWF, UNEP, UNDP and many governments.
A review in 2008 produced for the European Commission concluded that the “Ecological Footprint” is a useful indicator of sustainable natural resource use that is both easy to communicate and understand.
Proponents of the “Ecological Footprint” have acknowledged some of the concept’s limitations and over the years have worked to refine it.
The first set of standards for proper calculation and communication of the “Ecological Footprint” was produced in 2006, and continual revisions are occurring.
Researchists had needed for a long time a method of quantifying what goes on in nature, i.e the world’s natural capital in very much the same way as organisations and individuals produce annual financial statements.
It would be advisable for anyone wanting to delve into ecological accounting to look at the excellent explanatory videos which are listed at the end of this blog.
Ecological accounting is much like financial accounting except we are dealing with the biological productive capacity of land and water on the “Income side” of the equation, a term we call “Biocapacity”, i.e. ecological creditor, and then on the consumption side, i.e the “Expense side” of the equation we are dealing with the resources that we humans use, a term we known as the “Ecological Footprint”, which is an ecological debtor.
The unifying currency which is used in the computation of “Biocapacity” and “Ecological Footprint” is a unit area of land called “global hectares per person per year” or gha for short. Data for the calculation of gha comes form the respected United Nations database of information.
Upto 15,000 bits of data per country are used annually in order to compute these two major indicesLike financial accounting where some currencies are stronger than others so the synonymous global hectares vary considerably in different parts of the world. The Global Footprint Network have managed to circumvent this problem by mathematically computing a standard gha (global hectare per person per year) by creating an average gha from the 12 billion hectares of biologically productive areas of the world.The “Biocapacity” of the earths production is pictorially, for sake of argument, represented here with a green earth.

The “Ecological Footprint” is represented here as the dirty man of the planet. The earth is appropriately dressed in a mask to suppress the transmission of COVID-19 and appropriately covered by all the icons of our consumption such as factories, high-rise buildings polluted waters and dead forests.

Like a profit and loss account, if the “Biocapacity” of a particular country exceeds its “Ecological Footprint” then that county is in a state called a “Biocapacity Reserve”.(i.e. making a biologically productive profit.)
A “Biocapacity Reserve” is represented here with the scales tipping in the favour of “Biocapacity”.

If, on the other hand, the “Ecological Footprint” exceeds the “Biocapacity” of a particular country then this is referred to as being in a state of “Biocapacity Deficit” i.e a biological loss which is synonymous to making a financial loss.
This is represented by the scales tipping in the earth suffering from the weight to “Ecological Footprint” because the earth is unable to generate enough productive biomass, i.e. “Biocapacity” for human consumption.

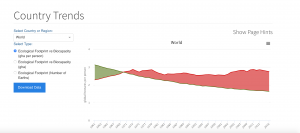
The Global Footprint Network have managed to compute estimates of “Biocapacity” and “Ecological Footprint” of 200 countries since the United Nations records began in 1960..
This has given us a remarkable insight into the ecological trend, a statement of biological health of this planet, since records began.
The resulting computations indicate that the average of 200 countries have been in continuous “Biocapacity Deficit” since the early 1970’s.
This is synonymous to the financials of a company showing a continuous financial loss since the 1970’s.
Between 1960 and 2016 the worlds population doubled from 3 billion to 7.4 billion. The fall in “Biocapacity” over this period is predominantly due to the global population increase.
In certain countries such as India and China the increased agricultural productivity led to increased “Biocapacity” ie. productivity expressed in global hectare per person per year has kept pace with their corresponding increase in population such that, unlike other countries, in the world the “Biocapacity” did not decrease over time.
An more in-depth analysis of Ecological Footprint and Biocapacity
Let us first deal with the expense side of the equation.
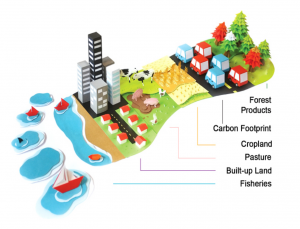
The “Ecological footprint” is defined as the measure of land and water area we need in order to produce the resources which we use i.e. things like food, timber, land for settlement, seafood and to absorb our waste and carbon dioxide that we generate.
Table of Ecological Footprints for selected countries for 1961 and 2016.
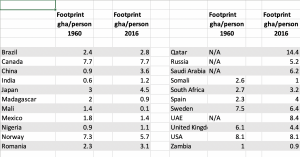
There are some general conclusions which can be drawn from this table:-
- The more developed countries will have more purchasing power, will consume more and will generate more waste than African countries and, as a result, their ecological footprint will be much higher than poorer African countries.An extreme example of contrasting purchasing power having an impact on the “Ecological Footprint” would be to compare Qatar with a GDP per capita of $138,910 in 2018 with the “Ecological Footprint” of Madagascar which has a GDP per capita of $1452. Here, Qatar, has an ecological footprint of 14.4 gha person per year whilst poor Madagascar has an ecological footprint 0.6 gha which is 24 times less than Qatar
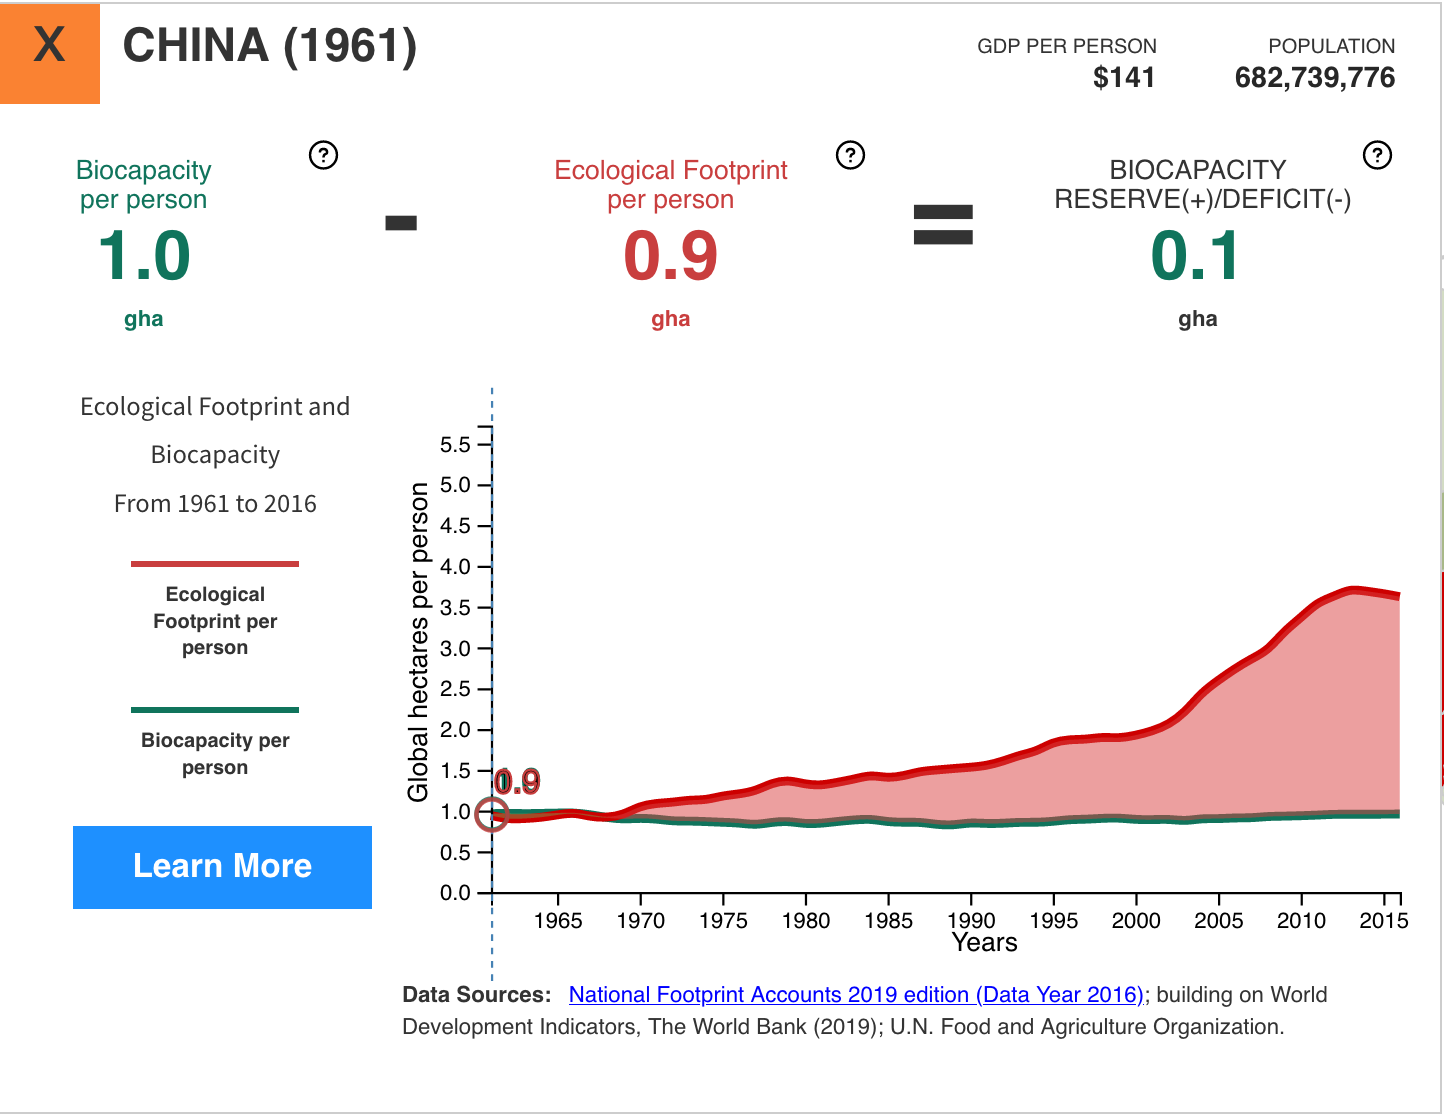
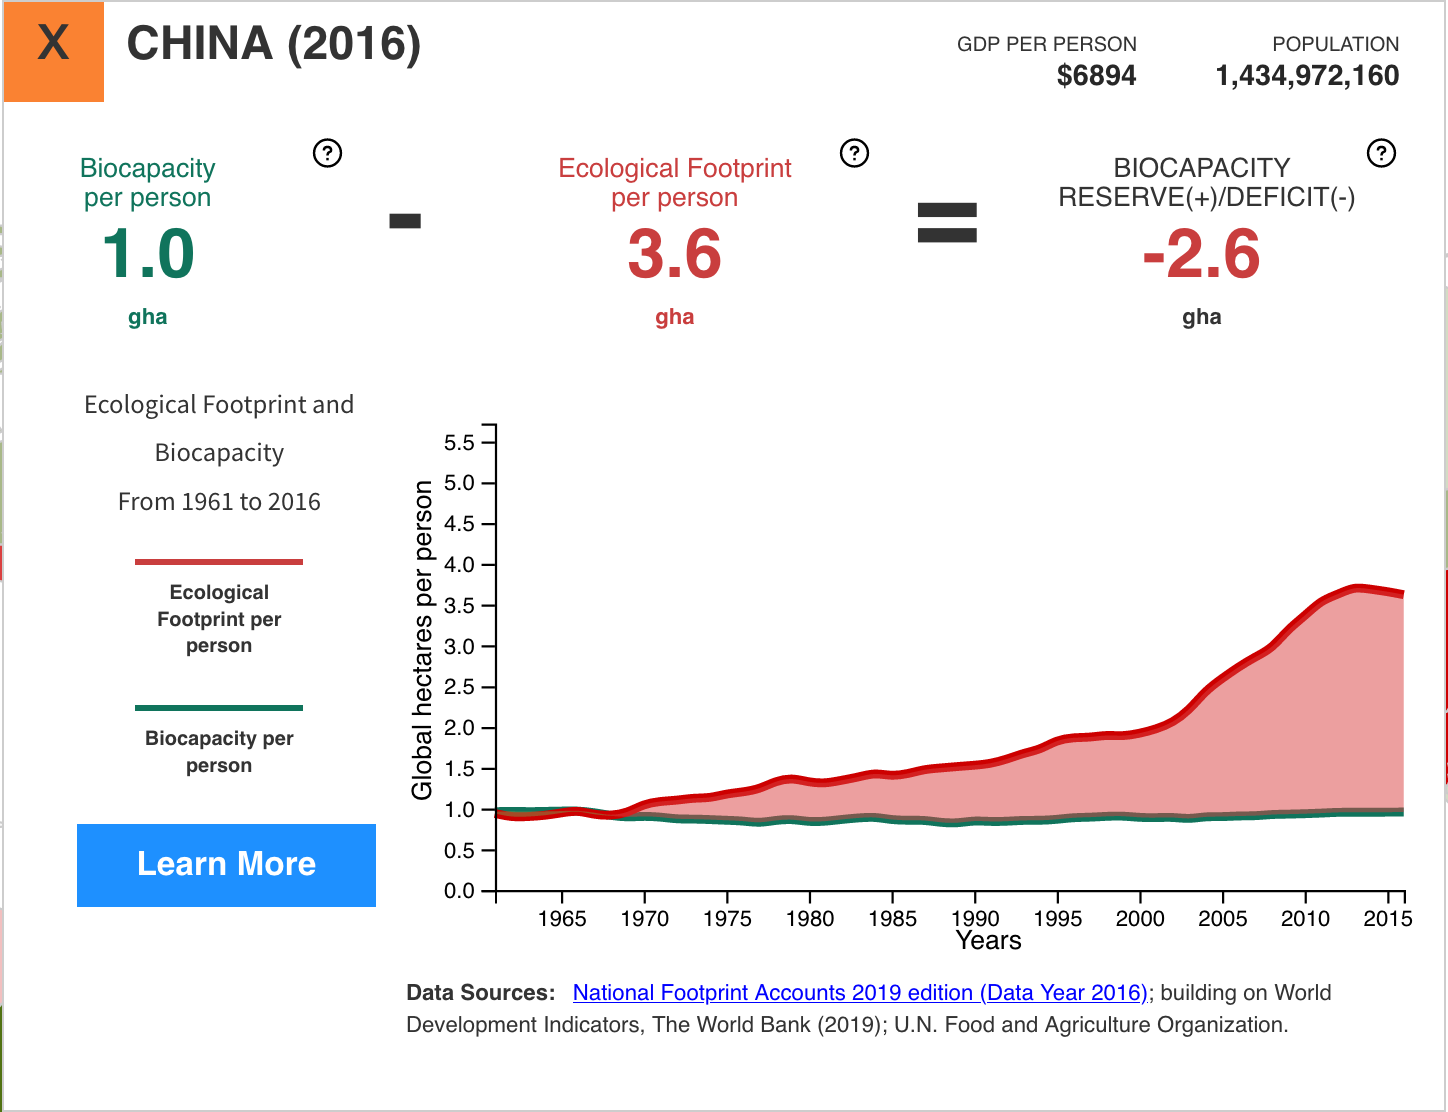
- Over the time period 1961 to 2016 China made a dramatic jump from 0.9 gha to 3.6 gha in its “Ecological Footprint” as it became a richer & more prosperous country.
- For Countries like Sweden, Norway and the UK, the very marginal decrease in “Ecological Footprint” between 1960 and 2016 are probably due to greater technological efficiencies and increased government regulation to reduce their carbon footprints.
It should, however be emphasised, that at-least half the “Global Ecological Footprint” is due to carbon emissions.
Let us now look at the profit side of the equation, i.e the “Biocapacity” of a country. This is the opposite to the “Ecological Footprint”.
“Biocapacity” is defined as the amount of biologically productive area such as forest, fishing- grounds, crop and grazing area that are available to provide the resources we use and to absorb our waste.”
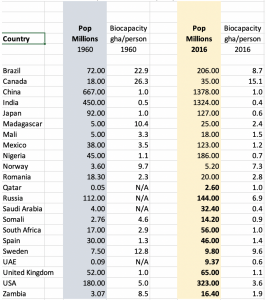
Table of Biocapacity figures for selected countries for 1961 and 2016
- The changes in “Biocapacity” between 1961 and 2016 are most marked for the less prosperous developing countries because increases in population have eroded their “Biocapacity” potential i.e. in Madagascar, the “Biocapacity” decreased from 10.9 in 1960 to 2.4 global hectares per person in 2016. This decrease can be accounted for by the fivefold increase in population over the same period.
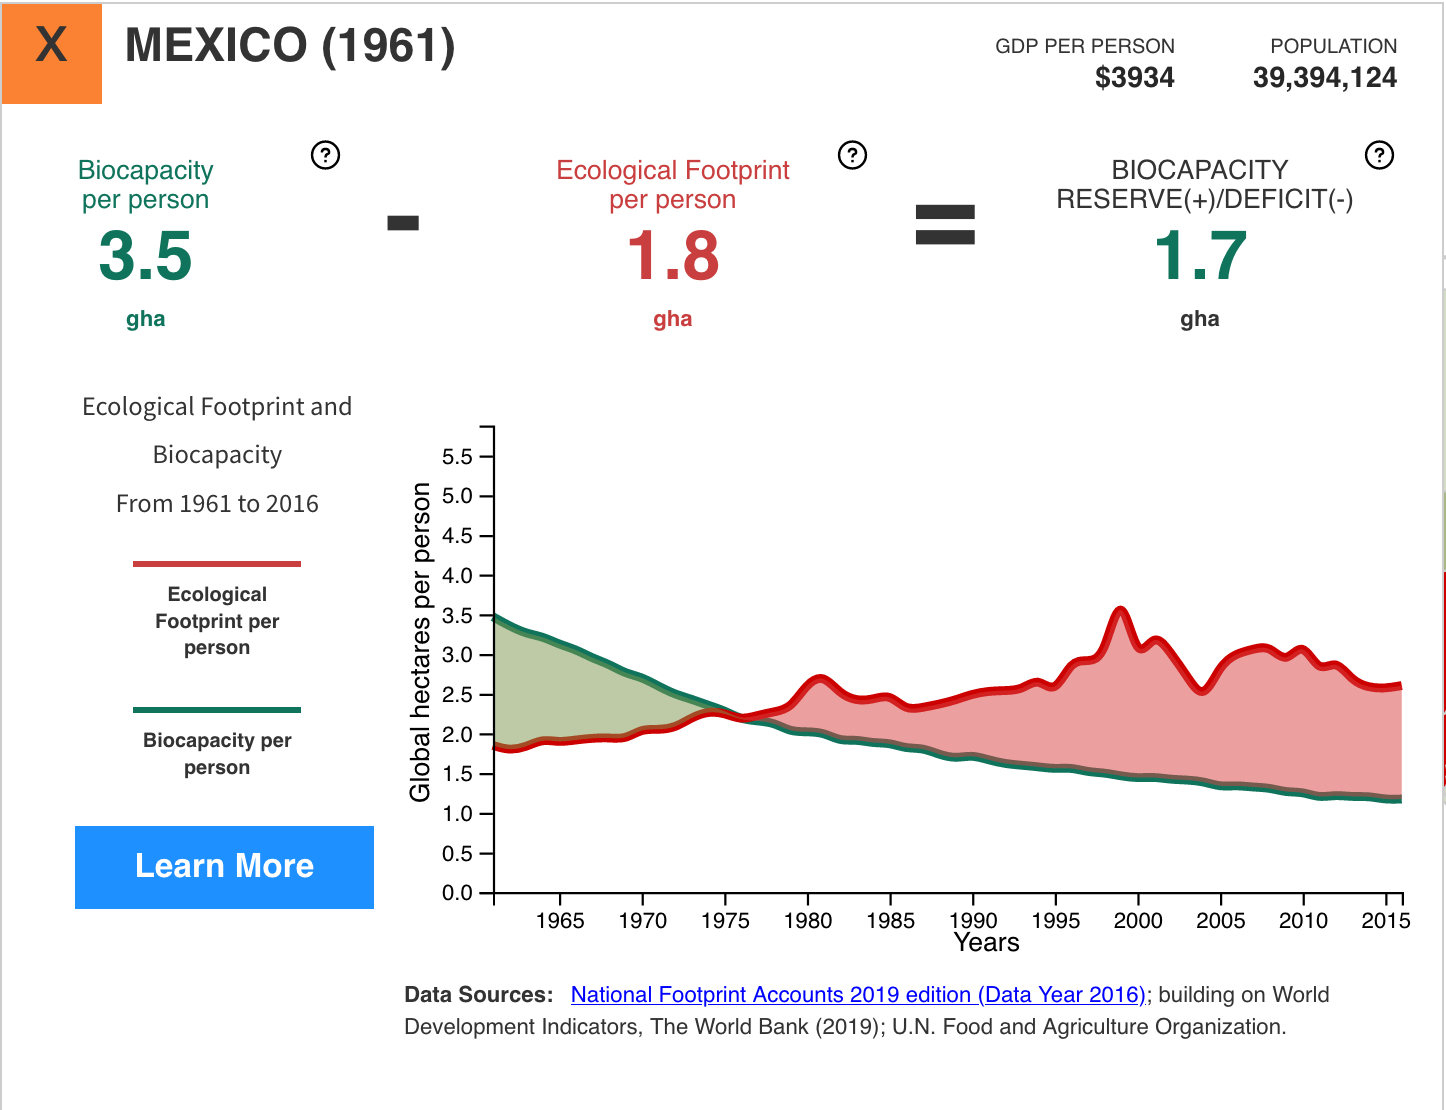
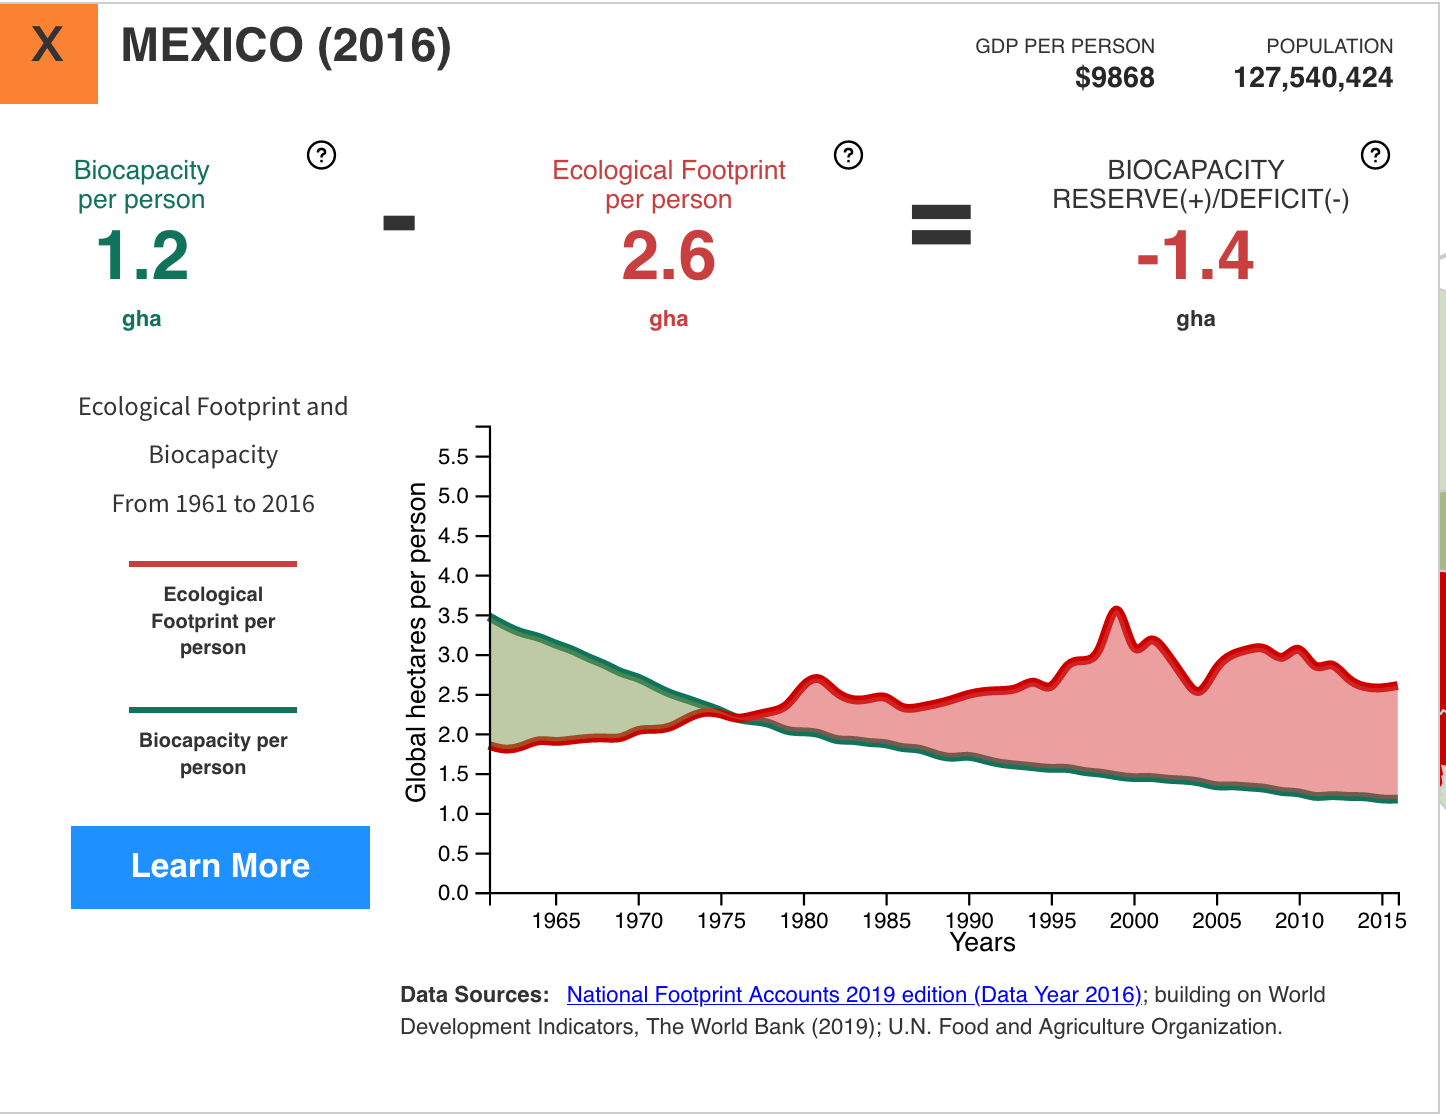
- In 1960 the “Biocapacity” of Mexico was 3.5 in 1960. This decreased to 1.2 gha in 2016. Over this time period it should be noted that there was a 4-fold increase in population.
- Somali’s “Biocapacity” decreased from 2.9 to 1 global hectare per person per year between 1960 and 2016. There was a 5-fold increase in population to 14.2 million in 2016.
- Countries like India and China did not see a decrease in their “Biocapacity” potential despite their considerable populations doubling in size. This is because both countries were able to take advantages of the scientific advances in agricultural science which occurred during this period. It should be noted that both these countries have sufficient rainfall to sustain increased crop yields. During the “agricultural revolution”. these countries experienced an impressive four fold increase in crop yield from 500 kg per hectare in 1960 to 2,000 kg per hectare in 2016.
- Overall, however, most countries saw a decrease in the “Biocapacity” between the period 1961 and 2016. This is largely due to an increasing population.
Table Showing Population and Biocapacity for selected countries
The final important Global Footprint concept to understand is the relationship between “Biocapacity” and “Ecological Footprint”.
If the “Ecological Footprint” i.e. the amount of land and water area it takes to sustain a human expressed in terms of “global hectares per per year per person” of a particular country is greater than its ability to regenerate what it consumes (i.e. greater than the resources that that country can provide for that population) then that country is said to be in “Ecological Deficit”.
If the reverse is true, then that country is said to be in “Biocapacity or Ecological Surplus” i.e. that country is said to have a “Biocapacity Reserve”.
By comparing any specific country’s “Biocapacity” with its “Ecological Footprint” it is then possible to see if that country is living sustainably or whether if it is living beyond its means.
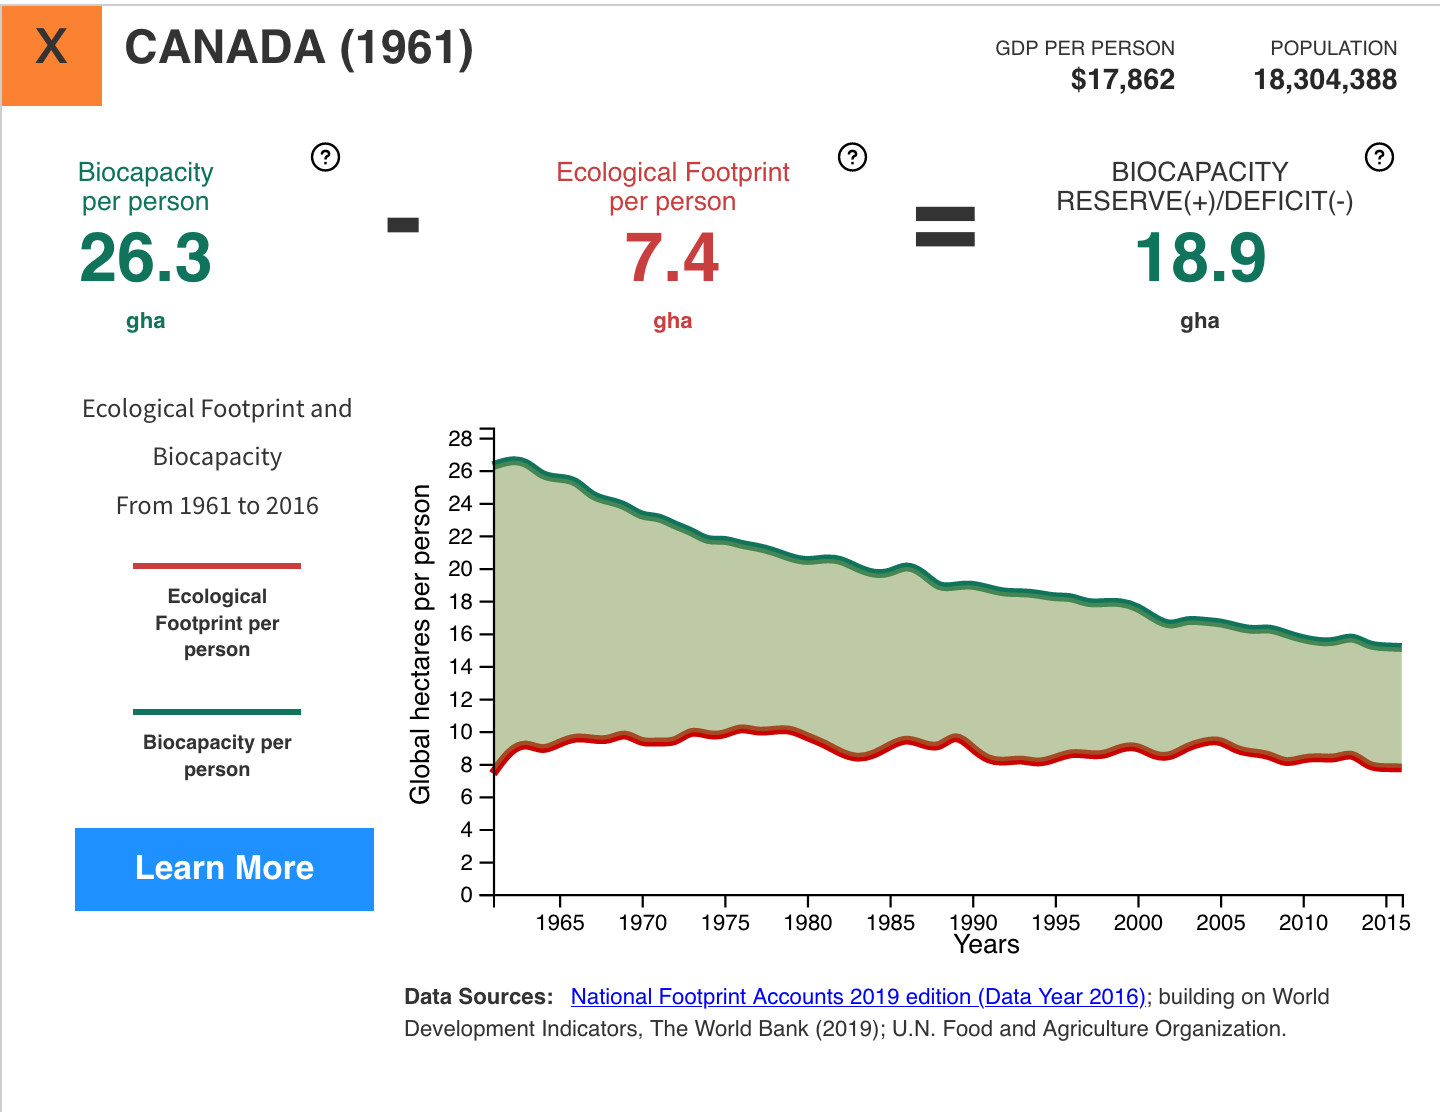
The relationship between “Biocapacity” and “Ecological Footprint” is expressed in this following simple equation:
Biocapacity” minus (-) “Ecological Footprint” = “Biocapacity Reserve (+)/Deficit”( – )
i.e. Using the Example of India.
In 1961 India had a “Biocapacity” of 0.5 gha and an “Ecological Footprint” of 0.6 gha. Hence using the above equation the “Biocapacity Reserve is minus (0.1).
It should also be noted that India’s “Biocapacity Deficit” decreased from a minus (01) in 1961 to a minus (0.8) global hectares per person in 2016.
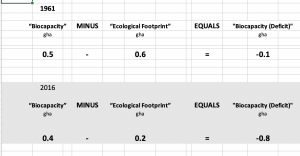
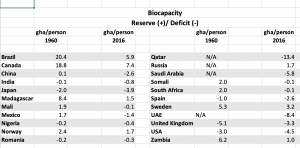
Table of Biocapacity Reserve /(Deficit) for selected countries on 1960 and 2016